
The problem: ESG decisions without a common foundation
Country-level ESG signals are everywhere, but a usable foundation is rare. Scores are scattered across different providers with different scopes, definitions, and update cycles, which makes it hard to compare exposure consistently across countries or trace a score back to the indicators that drive it.
Meanwhile, the pressure to substantiate country-level ESG assumptions keeps rising. The Corporate Sustainability Reporting Directive (CSRD), the Corporate Sustainability Due Diligence Directive (CSDDD), the IFRS Sustainability Disclosure Standards, and similar regimes all expect organizations to evidence the assumptions behind portfolios, value chains, and transition plans. Teams are routinely asked to defend country choices in front of regulators, boards, and clients, and they need a single, transparent, comparable view of the exposure behind those choices.
What you get: decomposable ESG exposure for 202 countries and regions
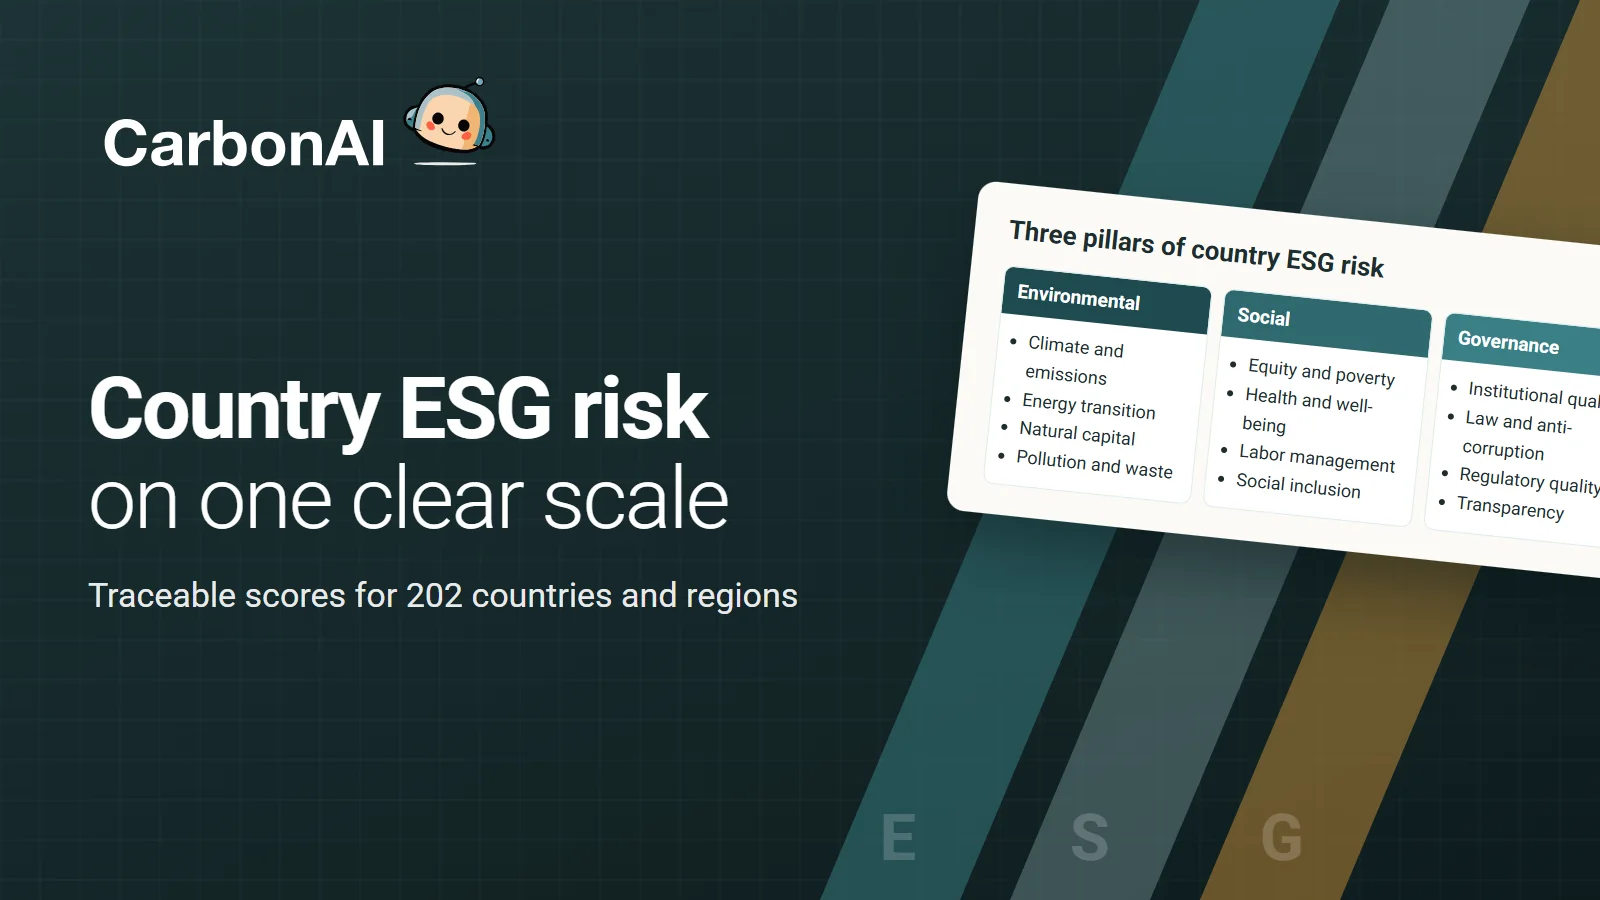
The ESG Risk Score is an AI-powered, country-level framework that quantifies downside exposure across Environmental, Social, and Governance dimensions for 202 countries and regions, calculated annually since 2005 on a 1 (low) to 100 (very high) scale, per country and per pillar.
Every score is decomposable to pillar and subcategory level, so you can see exactly what drives a country’s exposure rather than working from a single composite label. The framework is built on more than one million public data points from sources such as the World Bank, OECD, and United Nations, is versioned for reproducibility and auditability, and updates automatically as underlying data changes.
What each pillar actually measures
Environmental (E)
- Climate and emissions management
- Energy transition and efficiency
- Environmental conditions
- Natural capital and land use
- Natural hazards and adaptation readiness
- Pollution and waste
Social (S)
- Equity and poverty reduction
- Health and well-being
- Human capital and education
- Labor management
- Quality of living
- Social inclusion and stability
Governance (G)
- Governance
- Institutional quality
- Law and anti-corruption
- Regulatory quality
- Transparency and accountability
Who it’s for
- ESG and impact investors comparing country exposure consistently across all three pillars before allocating across markets.
- Supply chain and procurement teams screening sourcing countries and monitoring pillar and subcategory scores as early-warning signals.
- Sustainability and compliance teams substantiating the country-level assumptions behind CSRD, CSDDD, and IFRS S1 and S2 disclosures.
- Strategy and market-entry teams assessing environmental, social, and governance conditions in one comparable framework.
- Policy analysts and researchers working with two decades of consistent, decomposable country-level ESG data.
What you can do with it
Explore the ESG dashboards through the overview, country profile, comparison, and classification views. Assess countries’ overall Environmental, Social, and Governance risk, examine detailed sub-dimensions, compare countries or regions, and identify the key ESG factors shaping project context and risk.
- Compare countries on equal terms: score every market in a portfolio or value chain on the same 1-to-100 scale, per pillar and overall.
- Trace any score to its drivers: decompose a country’s exposure to subcategory level, from climate and emissions management to law and anti-corruption.
- Evidence a disclosure: back the country-level ESG assumptions in a regulatory filing with quantified, source-traceable scores.
- Watch for emerging exposure: track pillar and subcategory movements over time as early signals, rather than waiting for annual third-party updates.
- Integrate into your own models: feed consistent country scores into supplier scoring, portfolio screening, or internal risk frameworks.
How CarbonAI does this differently
A single composite label is only as useful as your ability to interrogate it, and most existing country ESG scores can’t be traced back to what produced them. CarbonAI is built the opposite way, by combining human expertise with machine scale. Domain experts define the taxonomy (the three pillars, their subcategories, and which indicators legitimately belong where), and every public indicator is mapped to that structure in a cataloged, reviewable way rather than ad hoc.
The measurement then runs continuously over more than a million public data points from institutions such as the World Bank, OECD, and United Nations, refreshing as the evidence changes rather than on a fixed annual cycle. No review team could weigh that volume, that often, and stay consistent, and no black-box label lets you check its work.
The result is expert-defined judgment applied at a breadth and freshness a manual process can’t reach, with every score decomposable to subcategory level and traceable to public sources. It supports due diligence and decision-making alongside independent judgment rather than replacing it, and works as a stand-alone tool for investing, supply chain management, regulatory analysis, market entry, and policy work.
See what drives ESG exposure in every market you touch. Explore the ESG Risk Score in CarbonAI Assess.