
The problem: SDG alignment often stops at the label
Almost every sustainability report references the UN Sustainable Development Goals. Far fewer can explain why a given investment, program, or geography was chosen because it addressed one of the deepest country-specific SDG gaps. That is the difference between SDG alignment and SDG intelligence.
The impact of an SDG commitment depends on the host country’s need. Supporting SDG 6 in a country with severe water and sanitation gaps is not the same as supporting SDG 6 where that need is already largely met. Without country-specific context, SDG alignment stays a narrative exercise rather than a decision tool.
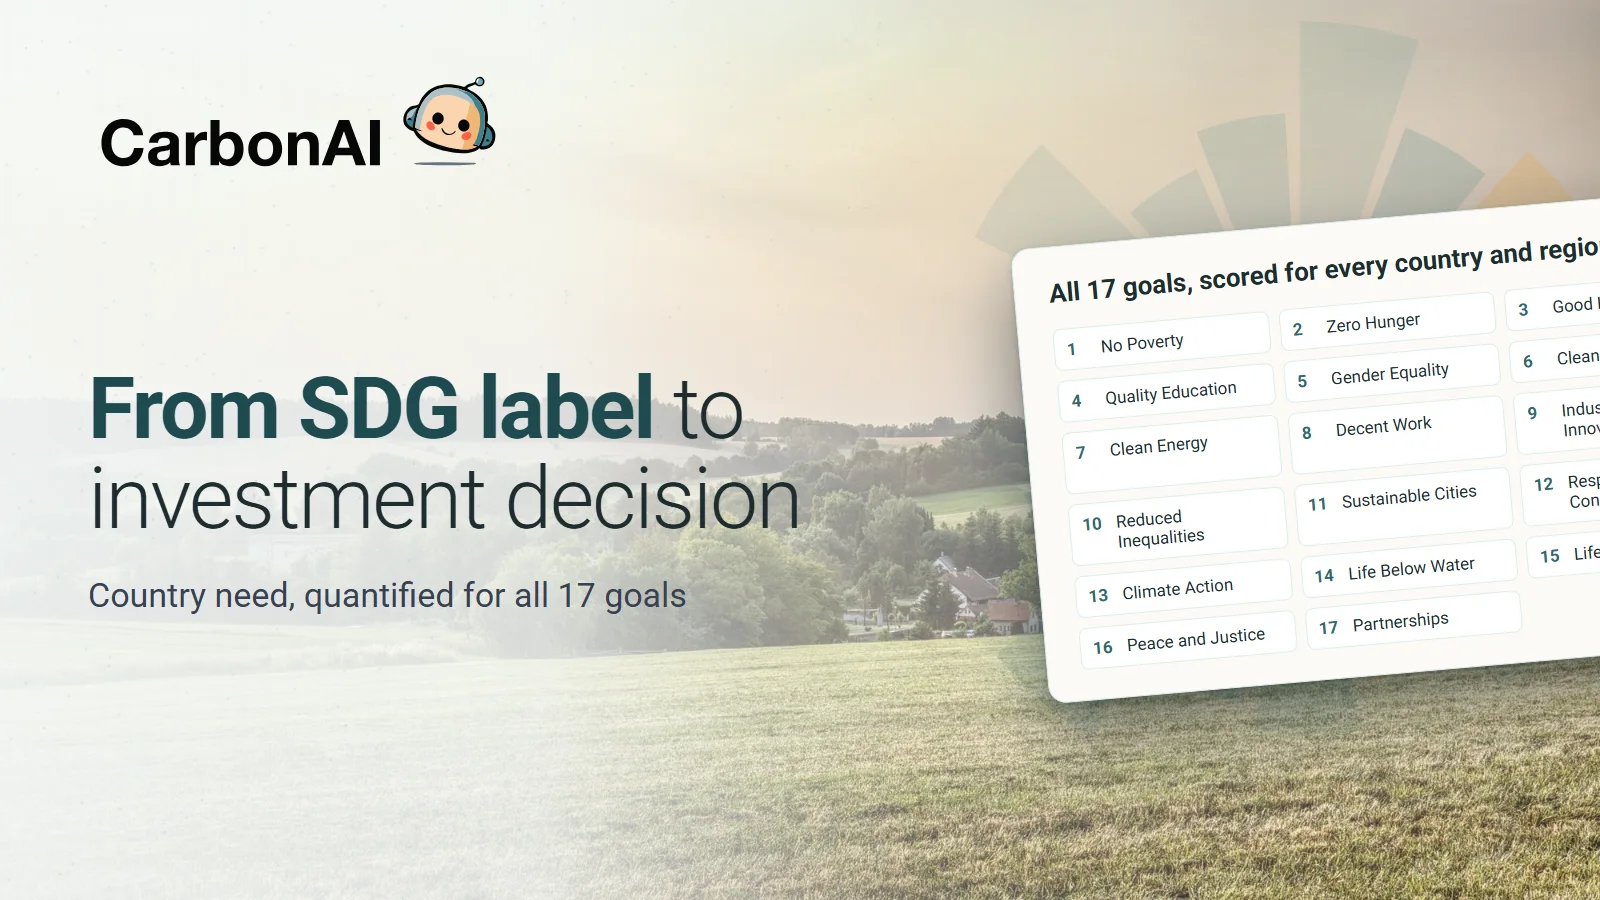
What you get: country-specific need, quantified for all 17 goals
The SDG Impact Index (SDG II) quantifies unmet development need across all 17 Sustainable Development Goals for 202 countries and regions, scored annually since 2005 on a 1-to-100 scale, where higher scores indicate greater unmet need and therefore greater potential for impact where that need is addressed.
Built on more than one million public data points from the United Nations, World Bank, and OECD, the index answers operational questions generic SDG mapping can’t: which goals have the largest remaining gaps in this country, how have those gaps changed over two decades, which geographies represent the strongest opportunity for a specific goal, and does a claimed SDG contribution line up with actual country need.
One comparable score for every goal, every country
- 1No Poverty
- 2Zero Hunger
- 3Good Health and Well-being
- 4Quality Education
- 5Gender Equality
- 6Clean Water and Sanitation
- 7Affordable and Clean Energy
- 8Decent Work and Economic Growth
- 9Industry, Innovation and Infrastructure
- 10Reduced Inequalities
- 11Sustainable Cities and Communities
- 12Responsible Consumption and Production
- 13Climate Action
- 14Life Below Water
- 15Life on Land
- 16Peace, Justice and Strong Institutions
- 17Partnerships for the Goals
Who it’s for
- Impact investors and allocators comparing opportunities across goals and geographies on one consistent scale.
- CSR and philanthropy teams directing community investment toward the countries and goals where marginal benefit is highest.
- Disclosure and reporting teams adding quantified, country-specific evidence behind SDG claims as reporting expectations tighten.
- Sustainability and procurement teams checking whether a project or partner’s claimed SDG contribution matches demonstrated need in its host country.
- NGOs, governments, and researchers analyzing SDG progress and gaps across 202 countries and regions from 2005 onward.
What you can do with it
Explore the SDG Impact Index through an interactive global overview or detailed country profiles. View overall and goal-level SDG impact, compare performance across regions and income groups, track one- and five-year trends, and identify the SDG areas with the greatest development need and potential impact.
- Choose where a goal needs you most: move from "we support SDG 6" to identifying the specific countries where clean water investment closes the largest gap.
- Screen commitments for substance: check whether a claimed SDG contribution matches demonstrated need in the host country before capital moves.
- Allocate budgets on evidence: rank candidate geographies and themes by quantified unmet need rather than familiarity.
- Strengthen disclosures: back each SDG statement in a report with an index score and two decades of underlying trend data.
- Track progress over time: use annual scores back to 2005 to see whether gaps in a target country are closing or widening.
How CarbonAI does this differently
Judging where an SDG needs attention most is genuinely expert work, but doing it consistently for 17 goals across 202 countries and regions, every year back to 2005, is beyond what any review team can hold in its head. That’s the gap between a credible SDG narrative and a defensible SDG decision.
CarbonAI closes it by pairing human expertise with machine scale. Domain experts define the framework, what unmet need means for each goal and which indicators legitimately measure it, and every public indicator is mapped to that structure by rule rather than case by case. Measurement then runs continuously over more than a million public data points from the United Nations, World Bank, and OECD, refreshing as new data lands.
So a score reflects expert-defined judgment about what each goal actually requires, applied with a breadth, consistency, and freshness a manual process can’t match, and it stays fully traceable to public sources. That’s what lets teams use the evidence before capital moves, not write the story afterward.
Turn SDG ambition into country-specific evidence. Explore the SDG Impact Index in CarbonAI Assess.